SCL Spotlight | Supply Chain Risk and Resilience
Day 240 Report Card
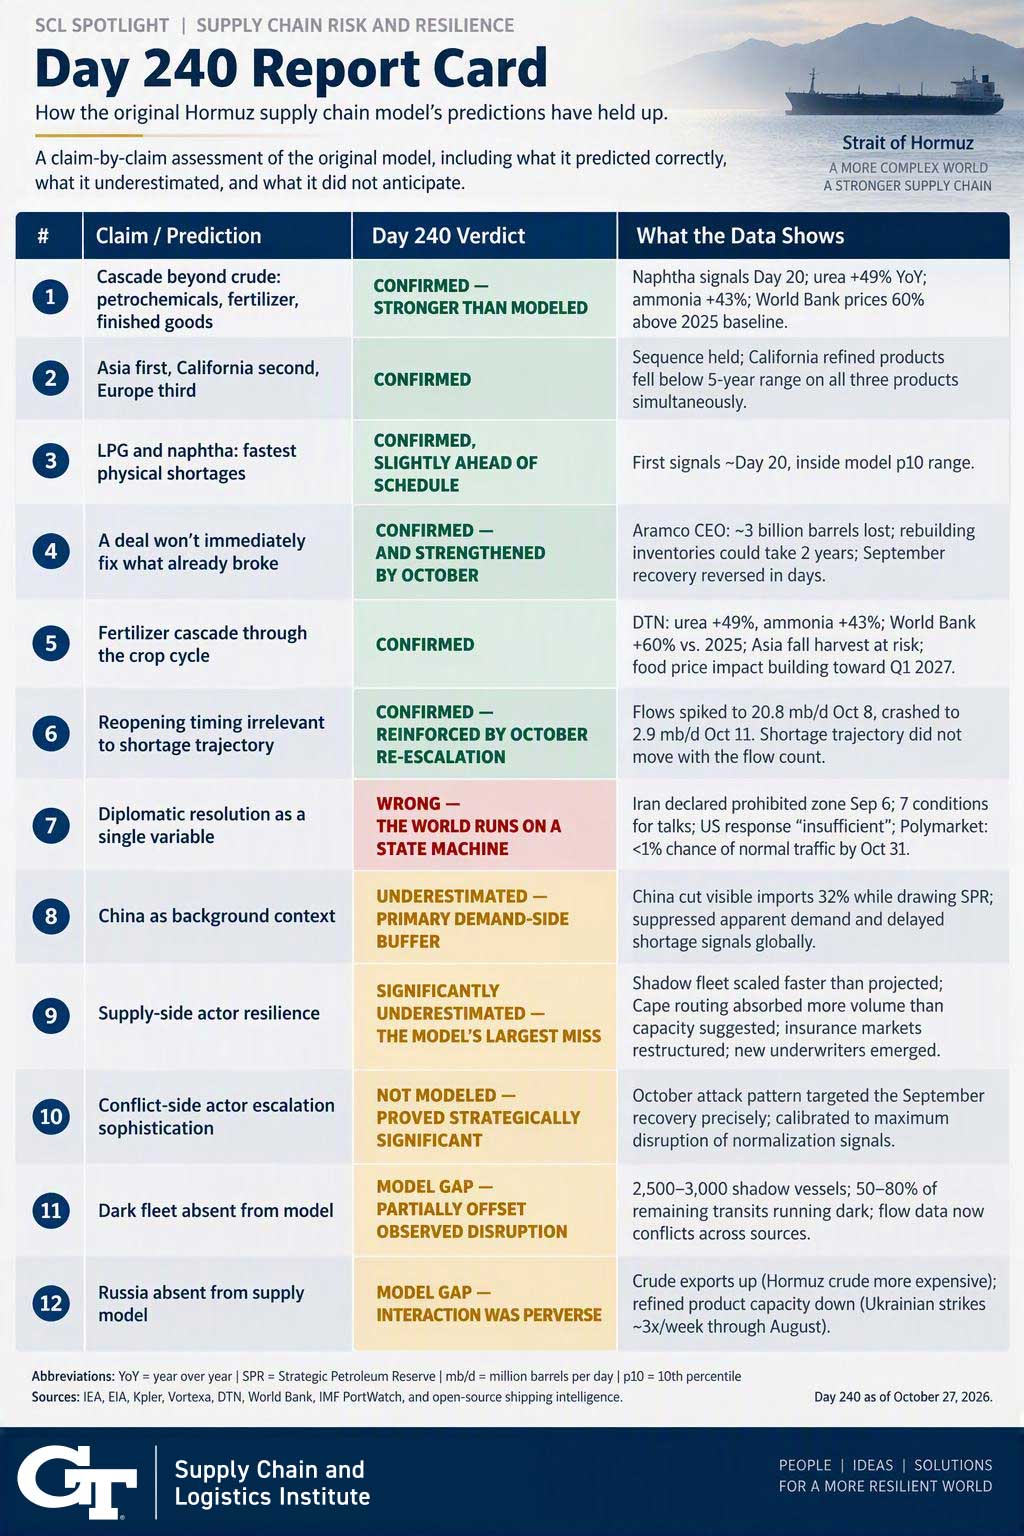
How the original Hormuz supply chain model's predictions have held up.
About this report card
A claim-by-claim assessment of the original model, including what it predicted correctly, what it underestimated, and what it did not anticipate.
This page provides an accessible HTML version of the Day 240 Report Card graphic.
Assessment
| Number | Claim or Prediction | Day 240 Verdict | What the Data Shows |
|---|---|---|---|
| 1 | Cascade beyond crude: petrochemicals, fertilizer, finished goods | Confirmed — stronger than modeled | Naphtha signals Day 20; urea +49% YoY; ammonia +43%; World Bank prices 60% above 2025 baseline. |
| 2 | Asia first, California second, Europe third | Confirmed | Sequence held; California refined products fell below 5-year range on all three products simultaneously. |
| 3 | LPG and naphtha: fastest physical shortages | Confirmed, slightly ahead of schedule | First signals ~Day 20, inside model p10 range. |
| 4 | A deal won't immediately fix what already broke | Confirmed — and strengthened by October | Aramco CEO: ~3 billion barrels lost; rebuilding inventories could take 2 years; September recovery reversed in days. |
| 5 | Fertilizer cascade through the crop cycle | Confirmed | DTN: urea +49%, ammonia +43%; World Bank +60% vs. 2025; Asia fall harvest at risk; food price impact building toward Q1 2027. |
| 6 | Reopening timing irrelevant to shortage trajectory | Confirmed — reinforced by October re-escalation | Flows spiked to 20.8 mb/d Oct 8, crashed to 2.9 mb/d Oct 11. Shortage trajectory did not move with the flow count. |
| 7 | Diplomatic resolution as a single variable | Wrong — the world runs on a state machine | Iran declared prohibited zone Sep 6; 7 conditions for talks; US response "insufficient"; Polymarket: <1% chance of normal traffic by Oct 31. |
| 8 | China as background context | Underestimated — primary demand-side buffer | China cut visible imports 32% while drawing SPR; suppressed apparent demand and delayed shortage signals globally. |
| 9 | Supply-side actor resilience | Significantly underestimated — the model's largest miss | Shadow fleet scaled faster than projected; Cape routing absorbed more volume than capacity suggested; insurance markets restructured; new underwriters emerged. |
| 10 | Conflict-side actor escalation sophistication | Not modeled — proved strategically significant | October attack pattern targeted the September recovery precisely; calibrated to maximum disruption of normalization signals. |
| 11 | Dark fleet absent from model | Model gap — partially offset observed disruption | 2,500–3,000 shadow vessels; 50–80% of remaining transits running dark; flow data now conflicts across sources. |
| 12 | Russia absent from supply model | Model gap — interaction was perverse | Crude exports up (Hormuz crude more expensive); refined product capacity down (Ukrainian strikes ~3x/week through August). |
Notes and sources
Abbreviations
- YoY: year over year
- SPR: Strategic Petroleum Reserve
- mb/d: million barrels per day
- p10: 10th percentile
Sources
IEA, EIA, Kpler, Vortexa, DTN, World Bank, IMF PortWatch, and open-source shipping intelligence.
Report date: Day 240 as of October 27, 2026.